April 16, 2026
The CPU widget was stuck at zero for months
The formula was load average over cores times 100. That is not CPU usage, and the chart was flat for months because of it.
The Eight.ly Professional dashboard has a "System Load" card with three progress bars: CPU, Memory, Disk. Memory and disk both moved. The CPU bar sat at 0.0% and had been flat since the feature shipped.
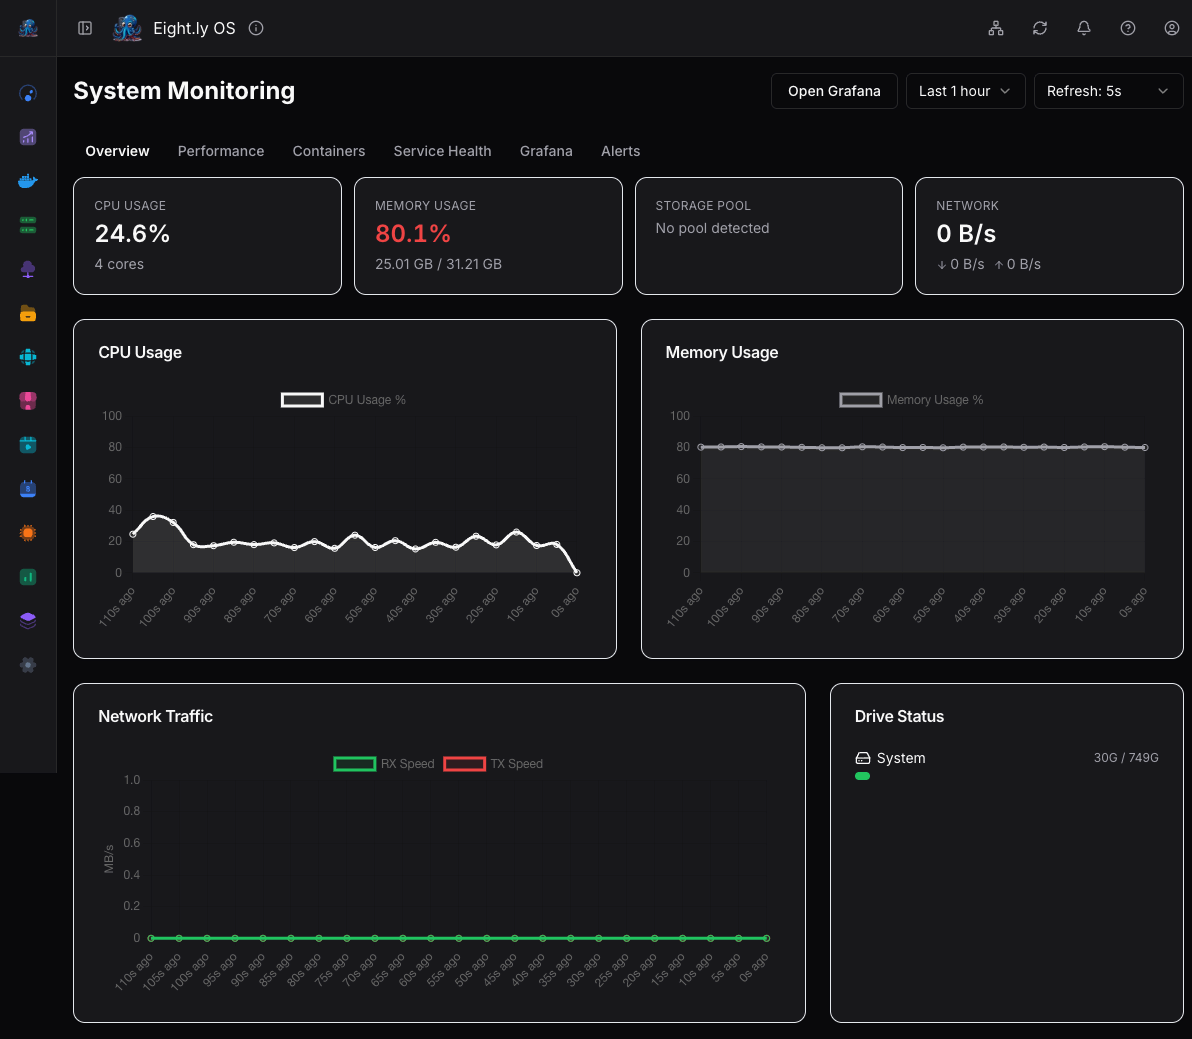
I never noticed because the only thing watching pro-dev was the dashboard itself, and the dashboard was the thing that was broken.
The formula was measuring the wrong thing
collectCPUStats in pkg/api/health/health.go shelled out to uptime, grabbed the 1-minute load average, and divided it by the core count:
// BEFORE
cmd := exec.Command("uptime")
output, err := cmd.Output()
if err == nil {
    uptimeStr := string(output)
    if strings.Contains(uptimeStr, "load average:") {
        parts := strings.Split(uptimeStr, "load average:")
        if len(parts) > 1 {
            loadParts := strings.Split(strings.TrimSpace(parts[1]), ",")
            if len(loadParts) > 0 {
                if load, err := strconv.ParseFloat(strings.TrimSpace(loadParts[0]), 64); err == nil {
                    cpu.LoadAverage = load
                    cpu.Usage = (load / float64(cpu.Cores)) * 100
                    if cpu.Usage > 100 {
                        cpu.Usage = 100
                    }
                }
            }
        }
    }
}
Load average over core count, times one hundred. Load average measures run-queue depth, how many tasks are runnable or waiting on I/O over a window, which is a different quantity from CPU utilization. On an idle VM the 1-minute load average prints 0.00. Divide that by four cores, multiply by a hundred, and you get zero forever.
The trap is that the formula is dimensionally plausible and it returns a sane-looking number at the extremes. Peg a single-core box and you get close to 100. But the load average can sit near zero while the CPU is genuinely at 50% doing request/response work, because nothing is queuing. pro-dev is idle 99% of the time, so the card read 0 the whole time.
The Performance History chart on the Monitoring page reads the same value. It was flat at zero too, for the same months.
/proc/stat is the right source, and I still got it wrong the first time
The correct way on Linux is to read the aggregate cpu line from /proc/stat, sample it twice a short interval apart, and compute (total - idle) / total over the delta. That is what I wrote. I parse the line into a total and an idle (idle plus iowait), sleep 150ms, read it again, and divide the busy delta by the total delta:
// AFTER
first, err := readProcStat()
if err != nil {
    return err
}
time.Sleep(150 * time.Millisecond)
second, err := readProcStat()
if err != nil {
    return err
}

totalDelta := second.total - first.total
idleDelta := second.idle - first.idle
if totalDelta == 0 {
    cpu.Usage = 0
    return nil
}
usage := float64(totalDelta-idleDelta) / float64(totalDelta) * 100
Load average still gets reported, read straight from /proc/loadavg into cpu.LoadAverage, because it is a useful number on its own even though it is not CPU usage.
I tested it with yes > /dev/null & yes > /dev/null & yes > /dev/null & on the dev VM and got back 75%, which was right, until the next poll came back at 0% again.
The cache was feeding the chart stale points
GetSystemHealth() had a result cache. The window was 30 seconds:
// BEFORE
func NewHealthChecker() *HealthChecker {
    return &HealthChecker{
        checkInterval: 30 * time.Second,
        startTime:     time.Now(),
    }
}
The Monitoring page polls /api/monitoring/metrics every 5 seconds and pushes every response into a history buffer. With a 30-second cache, one poll in six computes a fresh sample and the other five return the same cached number. So the chart plateaus for 30 seconds, jumps, plateaus again. Even once the formula was correct, the line looked dead between the steps.
I cut the cache to 2 seconds. The 5-second poll now always lands on a fresh sample, and the chart started moving.
// AFTER
checkInterval: 2 * time.Second,
And now the alerts would never stop
Fixing the metric exposed the next problem. MonitoringService ran a separate check loop that compared the live metric against the alert thresholds. Every cycle it appended a new alert with an ID derived from the clock:
// BEFORE
if health.CPU.Usage > ms.alertThresholds.CPUUsage {
    alerts = append(alerts, Alert{
        ID:        fmt.Sprintf("cpu_%d", time.Now().Unix()),
        Type:      "cpu",
        Severity:  ms.getSeverity("cpu", health.CPU.Usage, ms.alertThresholds.CPUUsage),
        Message:   fmt.Sprintf("High CPU usage detected: %.1f%%", health.CPU.Usage),
        Timestamp: time.Now(),
        // ...
    })
}
A sustained CPU spike produced a fresh alert every cycle, each with a different ID like cpu_1713234567. The Alerts tab would fill with dozens of identical "High CPU usage detected" rows.
It was three bugs stacked.
The ID came from time.Now().Unix() instead of the metric, so even in theory you could not resolve a CPU alert by ID, because there was no stable target to resolve.
The resolve endpoint was a stub. handleAlertResolve returned {success: true} and never touched AlertHistory. The comment said exactly that:
// BEFORE — handleAlertResolve
// For now, just return success since the monitoring service doesn't have
// a method to resolve specific alerts by ID
response := Response{
    Success: true,
    Data:    map[string]string{"id": alertID, "status": "resolved"},
    Message: fmt.Sprintf("Alert %s resolved successfully", alertID),
}
json.NewEncoder(w).Encode(response)
"For now" had been a while.
And there was no auto-resolve. When CPU dropped back below threshold the active alert stayed active. The only way to clear one was manual resolution, except manual resolution did nothing. The Alerts tab was a write-only log.
Fixed all three in one pass
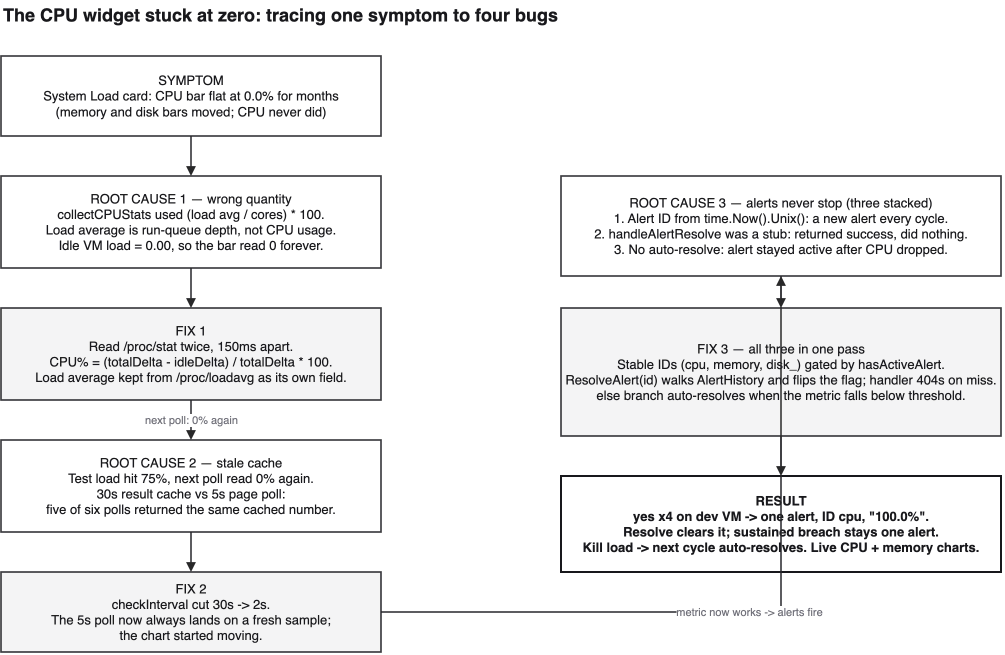
Stable IDs. The CPU alert is cpu. Memory is memory. Disk is disk_<mount>. A hasActiveAlert(id) check gates whether the loop appends a new one, so a sustained breach is one alert with one ID:
// AFTER
if health.CPU.Usage > ms.alertThresholds.CPUUsage {
    if !ms.hasActiveAlert("cpu") {
        ms.metrics.AlertHistory = append(ms.metrics.AlertHistory, Alert{
            ID:       "cpu",
            Type:     "cpu",
            Severity: ms.getSeverity("cpu", health.CPU.Usage, ms.alertThresholds.CPUUsage),
            Message:  fmt.Sprintf("High CPU usage detected: %.1f%%", health.CPU.Usage),
            // ...
        })
    }
} else {
    ms.resolveActiveAlert("cpu")
}
Auto-resolve. The else branch above does it: if the metric is below threshold and there is an active alert with that ID, mark it resolved and stamp ResolvedAt, no user action needed.
Real resolve. ResolveAlert(id) actually walks the slice, finds the matching unresolved entry, and flips the flag. The handler calls it instead of faking success:
// AFTER
func (ms *MonitoringService) ResolveAlert(alertID string) bool {
    ms.metrics.mutex.Lock()
    defer ms.metrics.mutex.Unlock()
    now := time.Now()
    found := false
    for i := range ms.metrics.AlertHistory {
        if ms.metrics.AlertHistory[i].ID == alertID && !ms.metrics.AlertHistory[i].Resolved {
            ms.metrics.AlertHistory[i].Resolved = true
            ms.metrics.AlertHistory[i].ResolvedAt = &now
            found = true
        }
    }
    return found
}
The handler now returns a real 404 when the ID is not found, instead of cheerfully reporting success on a no-op. I also added ClearResolvedAlerts() so the "Clear Resolved" button actually drops the resolved rows and returns a count, and moved the subscriber fan-out outside the AlertHistory lock so a slow subscriber can't stall the monitoring loop.
The full lifecycle test
Ran yes > /dev/null & four times on the dev VM. Waited for two monitor cycles. Hit /api/monitoring/alerts. One alert, ID cpu, severity warning, message "High CPU usage detected: 100.0%".
Clicked Resolve in the UI. One request to POST /api/monitoring/alerts/cpu/resolve. Refreshed, and the alert showed resolved: true with resolved_at set. The next cycle saw CPU still over threshold but the cpu alert already resolved rather than active, so it appended a fresh one, which kept it at one alert rather than a duplicate pile.
Killed the yes processes. Next cycle, CPU dropped below threshold, the loop hit the else branch and auto-resolved, and the Alerts tab went quiet on its own.
The autopsy
Two separate failures lined up here.
The shipping bug was a unit-of-measure mistake: the original code treated load average as CPU usage. They are not the same quantity, and (load / cores) * 100 happens to look right and even returns the right number on a saturated single-core box, which is exactly the kind of wrong that survives a glance.
The detection bug is the more serious one. The graph was flat for months and nobody saw it, because the only monitoring we ran against pro-dev was the Eight.ly dashboard, and the dashboard was the thing reporting wrong, which left no second pair of eyes on it.
What I want is a synthetic-load check in CI on every Monitoring PR: spawn yes > /dev/null & four times on a test VM, wait, hit /api/monitoring/metrics, assert CPU is over 50%, kill the load, wait, assert it is back under 30%. That would have caught "always 0" the first time it happened.
That test does not exist yet. It should, and until I write it the next regression in this code will be just as invisible as this one was.