March 13, 2026
The quiet weight of systems at scale
When Traefik goes down, 20 services follow. What running 34+ containers taught me about dependency awareness and infrastructure that fails gracefully.
The 3 AM lesson
I woke up to 14 alerts on Telegram. Plex was down. Sonarr, Radarr, Grafana, Portainer, Authelia, all down. My phone was buzzing with P1 alerts from a system I'd built specifically to tell me when things broke.
The root cause was Traefik. It had crashed, and one reverse proxy going down took out every service behind it. The services themselves were running fine. Nothing could reach them, so they were all unreachable, and the alert system reported each one as its own failure.
That's what I mean by the quiet weight. Your infrastructure looks solid right up until one node fails and you find out that everything was leaning on it.
Dependencies you don't see
I run 34+ containers across multiple Docker hosts: Proxmox VMs, a dedicated Docker host, an Unraid storage server, and a Mac Mini for CI/CD. Roughly, it stacks in five layers. At the bottom is the network: the UDM Pro, Cloudflare tunnels, and DNS. Above that is routing: Traefik, SSL termination, and Authelia SSO. Then compute: Proxmox and the Docker hosts. Then storage: Unraid, NFS mounts, and SnapRAID, with all 34+ application services sitting on top.
Every layer depends on the one below it, and the layers aren't the whole picture. There are lateral dependencies too. Sonarr needs Prowlarr for indexers. Plex needs the NFS mount from Unraid. Grafana needs Prometheus, which needs exporters running on every host. Authelia needs Redis. Almost nothing is genuinely standalone.
I didn't really understand any of this until I mapped it.
Building the dependency graph
I built a dependency graph into Mission Control, my ops dashboard. 34 nodes, 5 failure domains, cascade failure analysis. When I click on a service, I can see what it depends on and what depends on it, so when something goes down I can see the blast radius right away.
The graph showed me things I'd never thought about:
- Traefik is a single point of failure for every external-facing service.
- The Unraid NFS mount is a single point of failure for all the media services.
- A Cloudflare tunnel going down kills remote access but leaves local access working, which is a different failure mode and deserves a different alert priority.
- Redis going down takes out Authelia, which takes out SSO, which locks everyone out of everything behind auth.
Alert priority: not everything is P1
Before the dependency graph, every alert was the same priority, which is to say loud. My phone would blow up with 14 near-identical "service unreachable" alerts when the real problem was a single process.
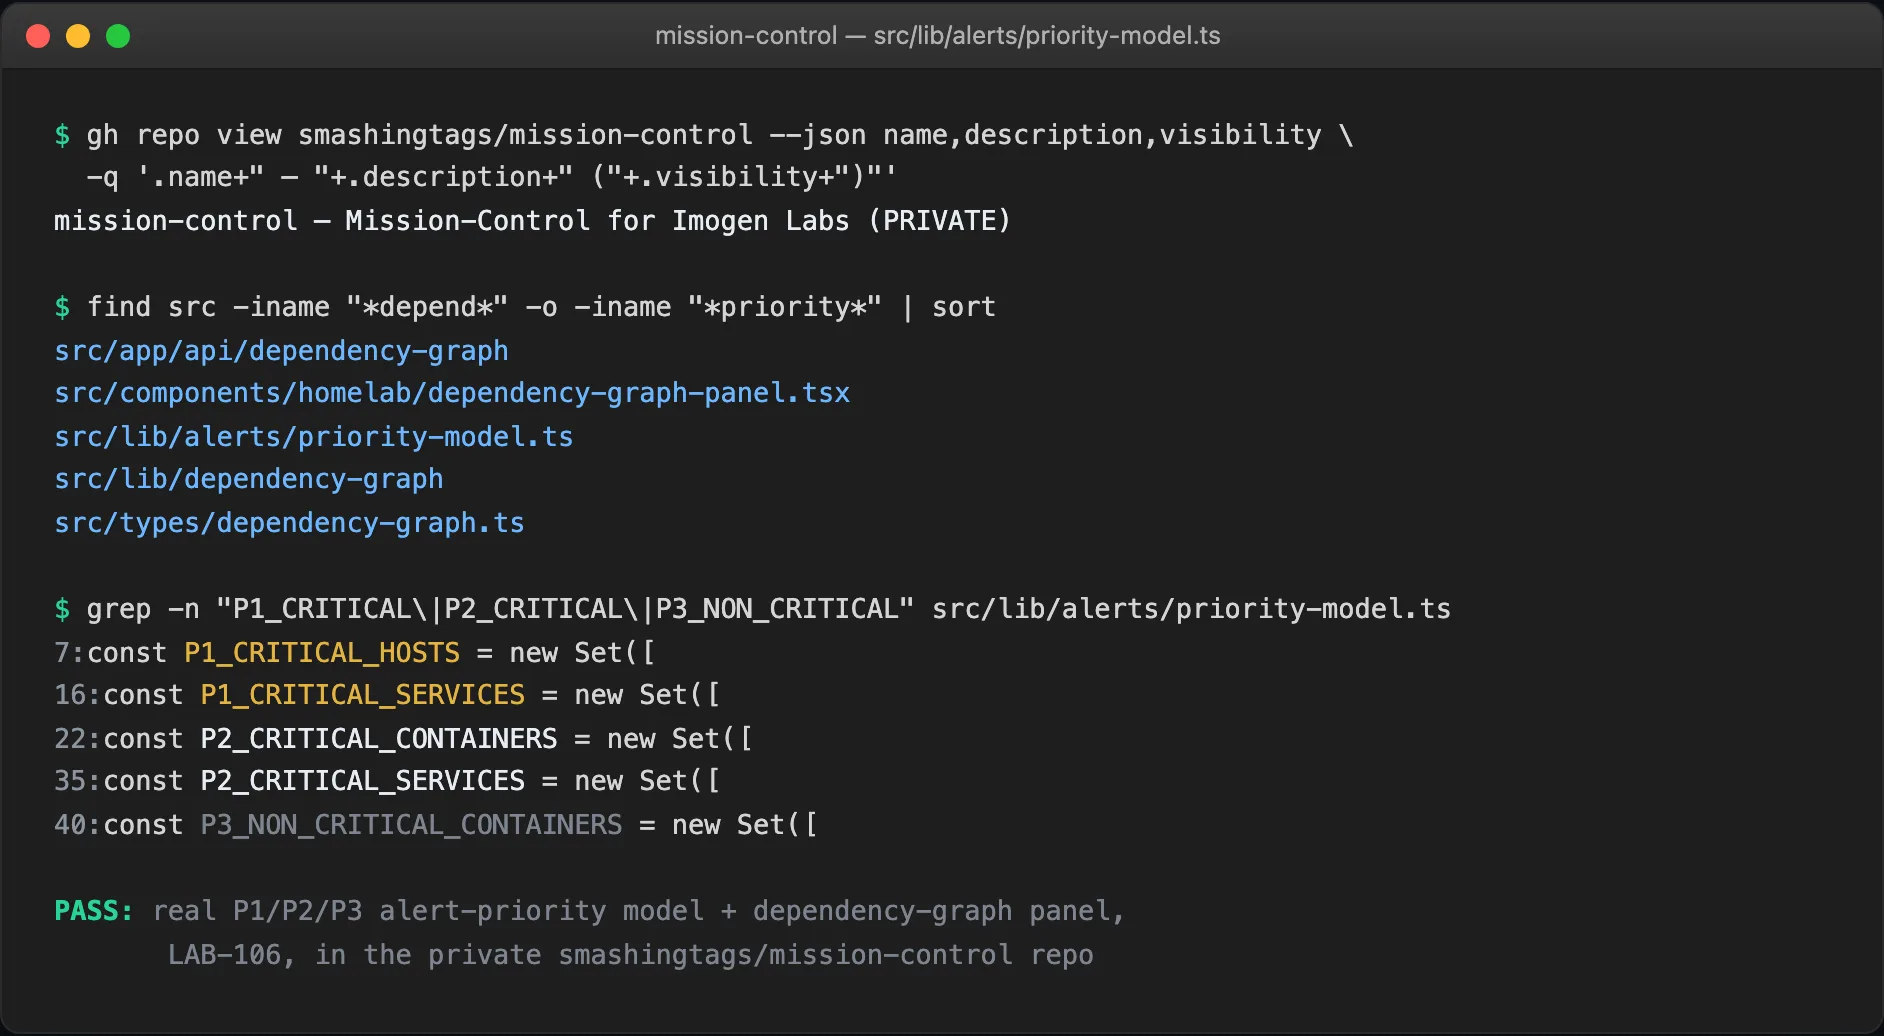
So I built a P1/P2/P3 model. A P1 is infrastructure down: Traefik, DNS, a Docker host, a storage mount. These cascade, so they wake me up. A P2 is a service down, where an individual app crashed but the infrastructure underneath it is fine. Fix it today, don't wake me up. A P3 is degraded: high memory, disk filling up, an SSL cert expiring soon, and those get batched into a digest.
P3s get rolled into a Telegram digest every 4 hours. P2s get individual notifications during waking hours. P1s wake me up. The point is that the alert system now treats most failures as symptoms of a dependency failure rather than 14 separate root causes.
What this taught me about building software
Running infrastructure at this scale, even "just a homelab," teaches you things that writing code alone never does.
You don't find a system's hidden dependencies until something breaks at 3 AM. Monitoring without priority is just noise, and 14 alerts for one failure means the alerting is broken, not the infrastructure. Past about 10 services you can't hold the topology in your head anymore, so a dependency graph stops being optional.
The part that surprised me most is how much weight sits on the boring middle layer. Nobody thinks about Traefik until it's down. Nobody thinks about DNS until it's wrong. The infrastructure that "just works" is exactly the infrastructure that takes everything down when it stops working. I can't afford to run two Traefik instances for redundancy, but I can make sure that when Traefik goes down, the alerts hand me the root cause instead of 20 symptoms.
That's the quiet weight. The more systems you run, the more of your head goes to holding the model of how they connect. You're not just running containers, you're maintaining an invisible web of dependencies that only shows itself when something fails. The best thing I've done is make that web visible before it breaks instead of after.
Built with Mission Control, an ops dashboard for managing infrastructure dependencies, alerts, and AI agents.